Serum Protein Electrophoresis
1
2
3
4
5
6
7
8
9
10
11
12
13
14
15
16
17
18
19
20
21
22
23
24
25
26
27
28
29
30
31
32
33
34
35
36
37
38
39
40
41
42
43
44
45
46
47
48
49
50
51
52
53
54
55
Serum Protein Electrophoresis
PROTEIN BIOCHEMISTRY
Glycoproteins
· Most plasma proteins are glycoconjugates. They are composed of one or more carbohydrate chain (glycans) covalently linked to aminoacidic moieties of polypeptides by glycosidic bonds
· N-glycans: glycans are covalently linked to the asparagine residue of polypeptides by an N-glycosidic bond
· O-glycans: glycans are covalently linked to the OH- of serine or threonine residues of polypeptides by an O-glycosidic bond
· The presence of a well defined carbohydrate chain is essential for the biological functions of the protein.
Plasma Protein Synthesis
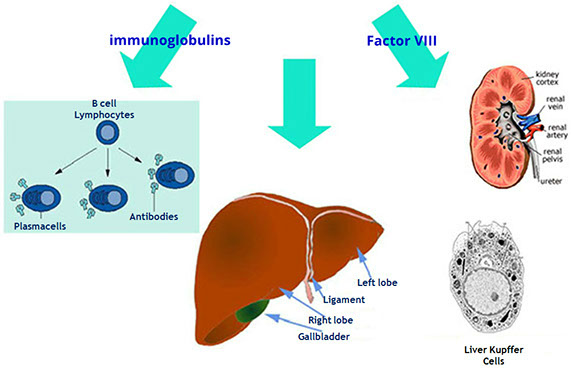
Plasma proteins are in dynamic equilibrium with tissues and biological fluids components.
Their synthesis is influenced by the nutritional state, general health conditions and hormones (tyroxine and cortisol increase albumin synthesis speed).
Each protein fraction is characterized by a peculiar turnover. They are degraded and discarded mainly at hepatic and gastrointestinal level.
PROTEIN BIOCHEMISTRY
Biological Matrices
Plasma Proteins
Urinary Proteins
Cerebrospinal fluid Proteins
Faecal Proteins
CLINICAL BIOCHEMISTRY OF PROTEINS
Qualitative and semi-quantitative approach:
electrophoretic techniques
Quantitative approach:
immunochemical techniques
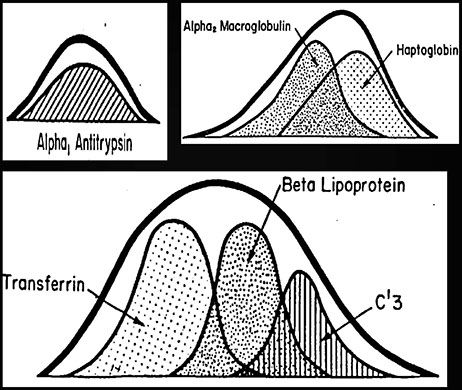
RESOLUTION CRITERA
Prealbumin
α1antitrypsin heterozygosity
Split α2 fraction: anodal component = α2-macroglobulin, cathodal component = haptoglobin
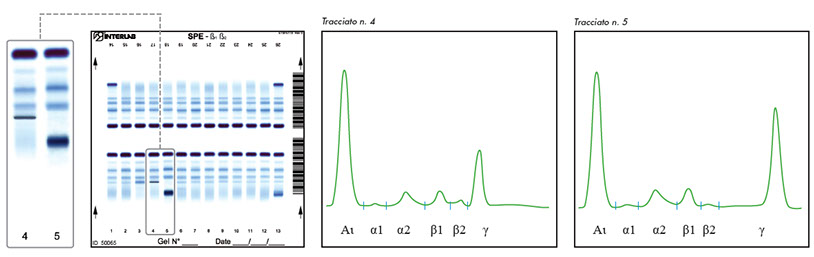
Split β fraction: β1 = transferrin, β2 = C3
Monoclonal components <1g/L e oligoclonality.
F. Aguzzi, D. Fenili, N. Montalbetti, C. Petrini, F. Salvatore, M. Tarantino
Official Recommendations of the SIBioC Committee. Serum protein electrophoresis.1° Biochimica Clinica 9; 1985
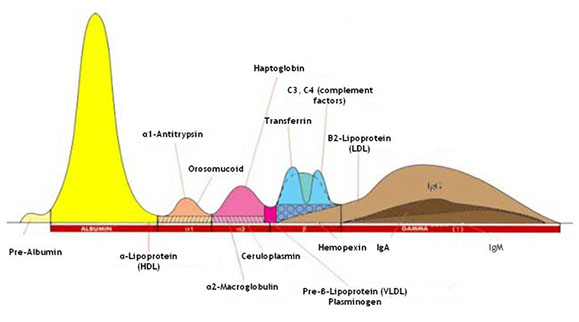
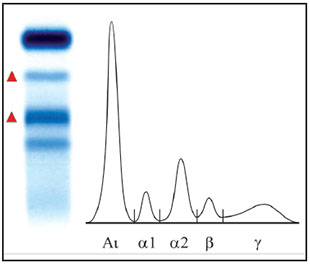
SERUM PROTEIN ELECTROPHORESIS
Albumin
α1AT
α2macro
HPTG
TRF
C3
γ-globulins
(Ig)
SERUM PROTEIN ELECTROPHORESIS
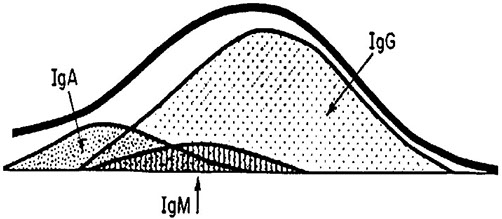
MAIN CONSTITUENTS OF THE GAMMA REGION
SERUM PROTEIN ELECTROPHORESIS
DIAGNOSTIC AIMS
· detection and quantification of monoclonal components
· detection of genetic proteins variants
· detection of induced protein variants
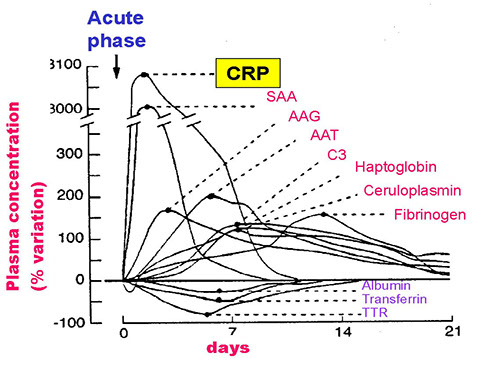
Acute-phase proteins
MONOCLONAL GAMMOPATHIES
Monoclonal gammopathies encompass a group of diseases characterized by the proliferation of one or more plasma cell clones (differentiated B cells). Each clone produces a variable amount of structurally and immunologically homogeneous immunoglobulins, also known as monoclonal components (MC) or paraproteins.
MONOCLONAL GAMMOPATHIES
The circulating MC may be composed of:
a) a complete immunoglobulin
b) only light chains
(free light chains)
c) only heavy chains (rarely)
SERUM PROTEIN ELECTROPHORESIS
INDICATIONS FOR APPROPRIATE REQUESTING SERUM PROTEIN ELECTROPHORESIS
Serum protein electrophoresis is the only technique that enables the detection of a MC by displaying the molecular homogeneity of the immunoglobulin.
While the prevalence of such condition does not advocate population screening, it is reasonable to propose the execution of this test for every adult admitted to hospital.
Due to the continuous progression of this disease, MC concentration monitoring is a useful and necessary laboratory parameter.
Graziani MS, Dolci A et al. Biochim Clin. 2008;32:48-51
SERUM PROTEIN ELECTROPHORESIS
INDICATIONS FOR REQUESTING SERUM PROTEIN ELECTROPHORESIS
Electrophoresis should be requested as screening test for patients with suspected myeloma, Waldeström's macroglobulinemia or MGUS.
The absence of a monoclonal component (MC) by electrophoresis does not exclude B cell lymphocyte neoplasias.
Upon clinical suspect, serum immunofixation (IFE) as well as urine IFE (for the detection of BJP) should be performed.
Results and comments
Results from this test should be accompanied by a "comment" from the laboratory staff who "validated" the result. The comment will ensure the correct interpretation of the analysis as well as its full comprehensibility to clinicians
Upon detection of a monoclonal component (MC), the quantification of the peak should be included in the report, along with the comment.

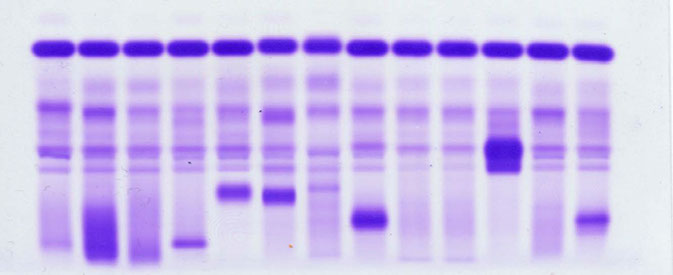
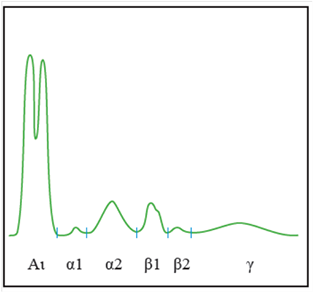
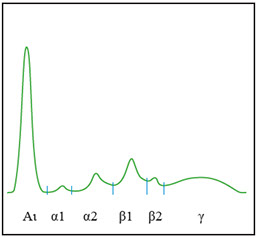
6-BAND Protein Electrophoresis
Interpretation Criteria
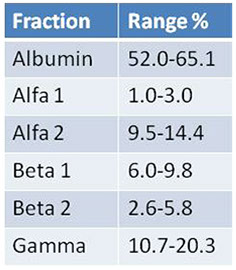
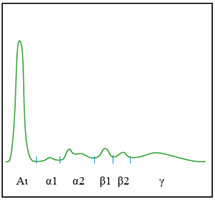
Human serum protein electrophoretic pattern
Identification of relative protein fractions
Data interpretation: information to be considered
Each fraction of the electrophoretic pherogram should be analyzed in order to detect the presence of qualitative and quantitative anomalies.
* Increased fractions
* Decreased fractions

* Presence of an unusual extra fraction or of a morphologically unusual fraction (distortion)
Data interpretation: what to consider
* Global aspects of the full pattern
* Colour and appearance of serum (haemolysis, icterus, turbidity or the presence of a precipitate)
* Concentration of total proteins
* Age of the patient. Every subject aged 45 and above is exposed to an increased risk of being affected by a monoclonal component.
Other information to consider:
* Fractions with flags (< or >) relatively to % values or in g/L
* If possible: patient's clinical history, previous test results, therapeutic treatments
* Clinical information (if available): bone pain, weight loss, anemia, increased ESR, hypercalcemia...
Main abnormal features of the electrophoretic pattern that do not require IT or IF


Main abnormal features of the electrophoretic pattern that do not require IT or IF
* Split albumin peak (bisalbuminemia)
· Congenital abnormality
Rare hereditary or acquired abnormality marked by the presence of two distinct albumin peaks (or by an enlarged albumin band) with different electrophoretic mobility
· Temporary
Drug-induced bisalbuminemia (especially by β-lactam antibiotics)
Pancreatitis (pancreatic enzymes may cause splitting of serum albumin)
Main abnormal features of the electrophoretic pattern that do not require IT or IF
* Increased lipoproteins or biliary pigments (due to biliary diseases)
Increased lipoproteins cause the appearance of an extra peak between alpha1 and albumin fractions (or as extra peak on the albumin fraction). Serum lipids and serum appearance should be verified.
Main abnormal features of the electrophoretic pattern that do not require IT or IF
* Increased α1, α2, β2 fractions, with or without a concomitant increase of immunoglobulins (inflammatory electrophoretic profile).
Inflammatory profile
Clinical Significance
Triggering factors: infections, trauma, surgery, burns, neoplasia and necrosis.
Acute-phase proteins: they encompass a variety of functions, such as mediation (CRP, C3) immunoregulation (CRP, a1GA), inhibition (a1-AT, HPT), reconstruction (a1-GA, a1-AT) and removal of inflammatory products (HPT).
It may be accompanied by a polyclonal or an oligoclonal variation in the gamma region of the electropherogram.
What is the diagnostic accuracy of Electrophoretic analysis for the detection and monitoring of inflammatory conditions?
1. EP is capable of detecting some acute-phase proteins. However, these proteins are neither sensitive nor early markers of inflammation.
2. EP is a semiquantitative technique. Thus, it is not suitable for disease monitoring.
Electrophoretic analysis is therefore not indicated for monitoring or detecting inflammatory conditions.
Main abnormal features of the electrophoretic pattern that do not require IT or IF
* Isolated increase of the alpha 2 fraction with a concomitant significant reduction of the total protein concentration (nephrotic syndrome).
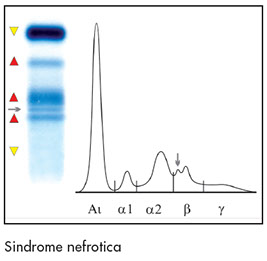
Nephrotic Syndrome
* Nephrotic syndrome
1) Proteinuria:
Generally above 3 g/day
2) Hypoprotidemia:
protein leakage into urine determines the following conditions:
- reduction of total serum proteins (below 6 g/dL)
- hypoalbuminemia
- increased a2 and ß2 globulin fractions
- reduced gamma fraction
Main abnormal features of the electrophoretic pattern that do not require IT or IF
* Isolated increase of the beta 1 fraction (in the absence of iron-deficiency) associated to a distortion of the alpha 2 fraction (Haemolysis: free Hb in the beta 1 region and Hpt–Hb complex in the in the alpha 2 fraction): check appearance of serum


Main abnormal features of the electrophoretic pattern that do not require IT or IF
* Increase beta 2 fraction with or without a concomitant hypergammaglobulinemia, and with a known hepatic affection or viral infection (polyclonal increase of IgA=beta-gamma bridge)
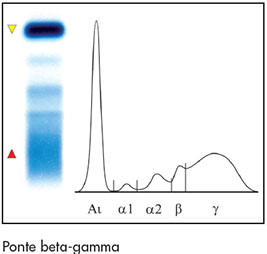
Β-Ƴ bridge
β-γ bridge
Clinical significance
Beta-gamma bridging is caused by a marked increase of polyclonal IgAs migrating in this region, along with increased IgM and IgG concentrations, typical of liver cirrhosis.
Main abnormal features of the electrophoretic pattern that do not require IT or IF
*Bifid alpha 1 fraction (different phenotypes of A1AT)
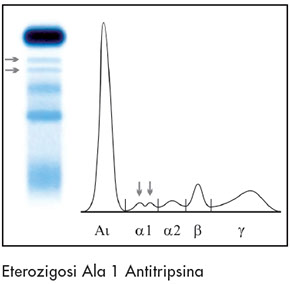
Alpha 1 Antitrypsin heterozigosity
A1AT deficiency
Clinical significance
α1-antitrypsin is a glycoprotein, accounting for over 90% of the antiproteinase activity in the blood.
MZ, SS, SZ and ZZ phenotypes are generally associated with low levels of α1-antitrypsin.
20-30% of liver cirrhosis in paediatric patients and pulmonary emphysema in adults aged 30-40 years are associated to the α1-antitrypsin ZZ phenotype.
This condition is caused by the destruction of the pulmonary tissue of the lungs by poorly inhibited elastases and collagenases.
It is important to communicate the presence of split peaks and diminished fraction in the alpha 1 zone, as well as to request quantitative analysis of serum α1-antitrypsin levels.
Main abnormal features of the electrophoretic pattern that do not require IT or IF
* Isolated distortion of the alpha 2 fraction in the absence of an increased concentration of the fraction itself and of hypogammaglobulinemia (different Haptoglobin phenotypes or slight haemolysis)


Main abnormal features of the electrophoretic pattern that do not require IT or IF
* Monoclonal components that have been previously identified and characterized (or as long as there are no variations in peak appearance and number).
CRYOGLOBULINS
Oligoclonal profile
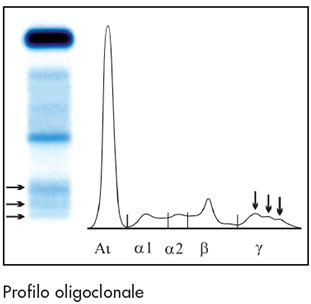
Oligoclonal profile
(infections, viral infections, autoimmune diseases, immunosuppressive therapy)
Commonly encountered bands resembling monoclonal components
Abnormal serum electropherograms may be due to the following reasons:
· Pathological conditions
· Physiological conditions
· Inappropriate sample storage
· Variants or different phenotypes of proteins
· Exogenous substances
Physiological protein patterns resembling monoclonal components
Complement degradation (C4) produces an additional peak in the Beta 2 region (left of the Beta 2 fraction)

Physiological protein patterns resembling monoclonal components
Acute phase proteins: CRP concentrations above 250 mg/L (depending on the polyclonal background) may cause the appearance of an additional peak in the gamma region (adjacent to the beta 2 region). Increased CRP is usually associated to an inflammatory profile (increased alpha 1, alpha 2 and beta 2).
Physiological protein patterns resembling monoclonal components
The presence of plasma Fibrinogen or poorly coagulated samples display an additional extra band close to (or within) the beta 2 fraction.
Physiological protein patterns resembling monoclonal components
Fibrinogen: interference removal
Fibrinogen interference may be removed by sample treatment with thrombin, reptilase or ethanol.
Agarose: add 10 ul of absolute ethanol (100%) for every 90 ul of serum. Incubate overnight at 4°C. Centrifuge and run by electrophoresis.
Capillary: 270 ul of serum + 30 ul of ethanol
MONOCLONAL COMPONENTS (MC) AS ANALYTES
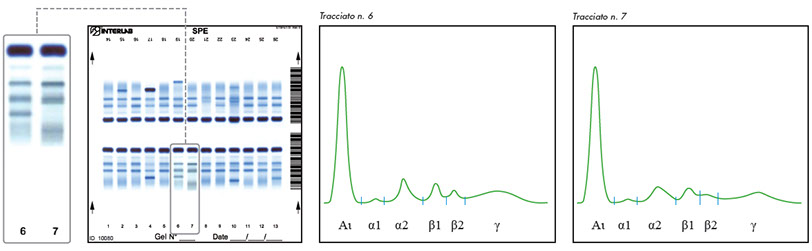
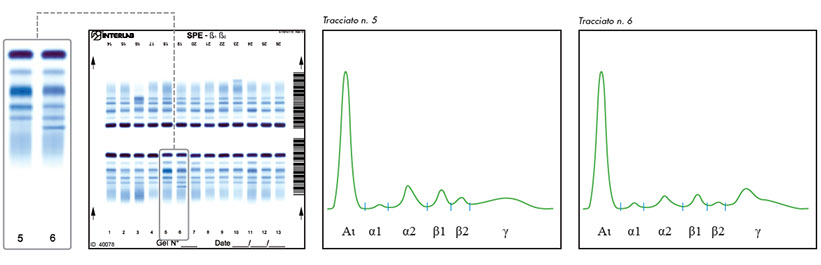
MCs typically appear as a sharp, narrow peak, corresponding to a homogeneous electrophoretic fraction.
Why is it important to report small monoclonal components?

It is of great importance to report all monoclonal components
Why is it important to report small monoclonal components?

It is important to report the presence of MCs in the context of the electrophoretic pattern as a whole.
SERUM PROTEIN ELECTROPHORESIS
QUANTIFICATION OF THE MC
· perform differential diagnosis of MGUS (CM <30 g/L) and MM (CM >30 g/L)
· evaluate the continuous risk for progression of MGUS to Multiple Myeloma over time
· evaluate response to therapy in patients affected by myeloma and by its correlated affections
SERUM PROTEIN ELECTROPHORESIS
QUANTIFICATION OF MCs
Leukemia 2006;20:1467-73
QUANTIFICATION OF MCs
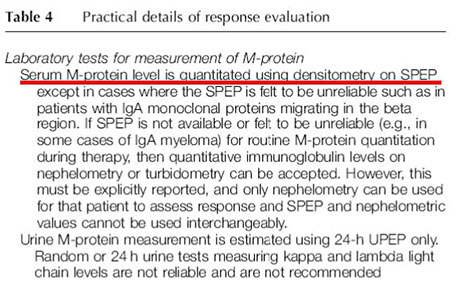
Upon detection by electrophoresis, each MC should be quantified by means of:
· densitometric scanning (AGE), or
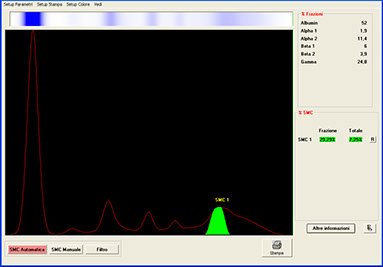
· by spectrophotometry (CZE).
QUANTIFICATION OF MCs
MCs are quantified by measuring the percentage value corresponding to the area of the peak (from the base line).
The concentration is then calculated on the basis of the total protein concentration within the sample.
QUANTIFICATION OF MCs: HOW MCs SHOULD (NOT) BE MEASURED
The fundamental disadvantage of immunochemical techniques is their inability to distinguish between monoclonal and polyclonal Igs. This is particularly important in follow-up, since disease progression is associated with an increase of the MC and a decrease of polyclonal Igs.
Merlini G. JIFCC 1997;9:171-6
QUANTIFICATION OF MCs: WHAT NOT TO DO
Quantitative immunochemical analysis of monoclonal immunoglobulins is inaccurate. The polyconal calibrator and the monoclonal analyte within the sample may not react in the same way with the assay antiserum (lack of parallelism). Moreover, monoclonal proteins may display poor antigenic specificity: thus, they may be badly recognized by the antiserum itself.
Graziani MS. Biochim Clin. 2008;32:48-51
SPE: qualitative & quantitative evaluation
· Patient undergoing follow-up. MC characterized by means of IF
· Hypogammaglobulinemia w/o visible peak
· MC of known entity & no visible peak
· urinary BJP and absence of serum MC
· Slight, isolated increases in α2, β1 or β2 fractions(no other abnormal features)
· Normal pattern
· Inflammatory
· Nephrotic
· Split α1 or α2
· Bisalbuminemia
· Haemolysis
· Hyperlipemia
· Beta-gamma bridge
· MC of known entity
Perform IF
Stop Investigation
Abnormal Pattern
Ambiguous
Pattern
Abnormal Pattern
No abnormal
features
Ambiguous
Pattern
Absence of Gammopathy
Repeat in 3 months
Gammopathy
>


